Testing RSS Feeds.. ignore post.
Testing RSS Feeds.. ignore post.
Process Server Statistics by Race

Process Server Statistics by Race
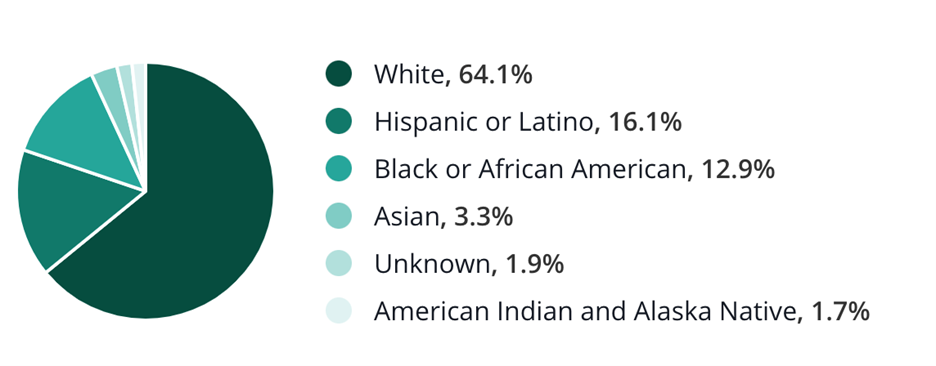
White is the most common ethnicity among process servers, accounting for 64.1 percent of the total. In comparison, 16.1 percent of the population is Hispanic or Latino, while 12.9 percent is Black or African American.

T: +1 (888) 360-legl (5345)
@: info@360legal.net
Author
We are Social!
Latest tweets
Popular Tags
Testimonials
"5 star service ! prompt serving, helpful, professional . "
"Mike is awesome. Our firm has hired him on several occasions and we are very happy with his work. His prompt serving, helpful, professional and always in communication. I recommend him highly! "
"360Legal provides speedy and easy to use Process Service that is flexible, and very transparent with nearly instant reporting. It is very helpful for us to be able to track the status of our process service jobs, especially when they are time sensitive. "
Latest News
-

RMAI 2021 Annual Conference RMAI Annual Conference
April 12-15, 2021 -

NATIONAL CREDITORS BAR ASSOCIATION 2020 SPRING CONFERENCE
May 19-21, 2021 -

ALFN ANSWERS 2021
Jul 18-21, 2021 -

Annual Convention and Expo
Oct. 17-21, 2021 -

Florida Association of Professional Process Servers 33rd Quarter Board Meeting/Professional Beach Getaway
Aug. 20-22, 2021


